While browsing the familiar vCenter UI right after an upgrade from 6.7U3 to 7.0U1 I noticed some small but nice changes I wanted to share.
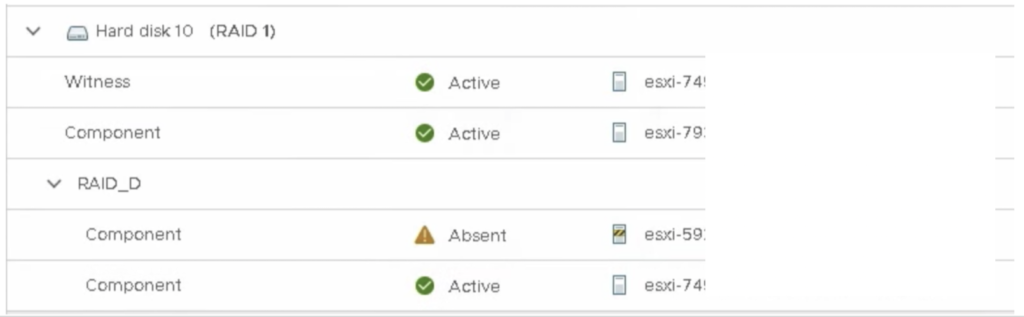
RAID_D for integrity
When we put a host in Maintenance Mode with Ensure Accessibility option we will see a new RAID type ->RAID_D. It guarantees that all new write operations have two copies of data (for data integrity). In the example below esxi-59 is in MM, so all new writes go to esxi-74 (as a backup for esxi-59) and to esxi-79. Note that Witness object in this example is also on esxi-74 node as the RAID_D component. It is because we have 3 node vSAN cluster.
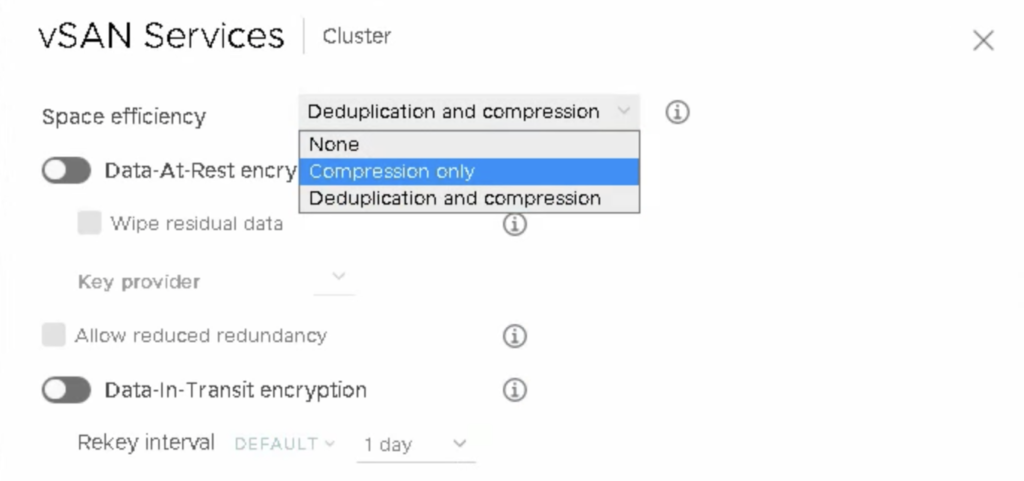
Compression ONLY
If the workload is not dedupe – friendly but can benefit from compression, now there is an option to enable Compression only on vSAN all-flesh datastore. The bonus is (in comparison to dedupe & compression) that in case of a failure of a capacity disk, whole disk group will NOT be unmounted.
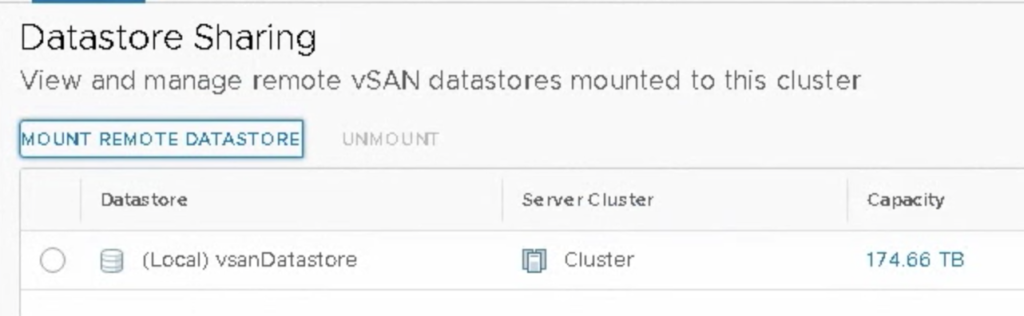
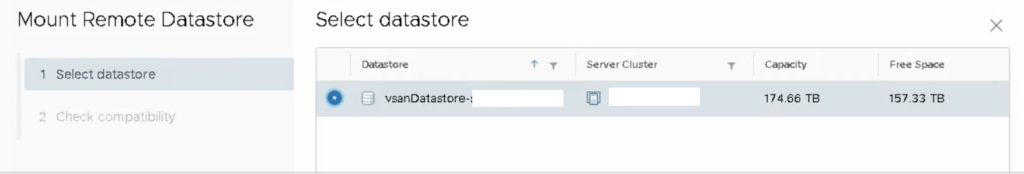
Datastore Sharing aka HCI Mesh
If you have more than 2 clusters under the same vCenter, you can mount vSAN datastore from the remote cluster and use as a spare capacity for VMs.
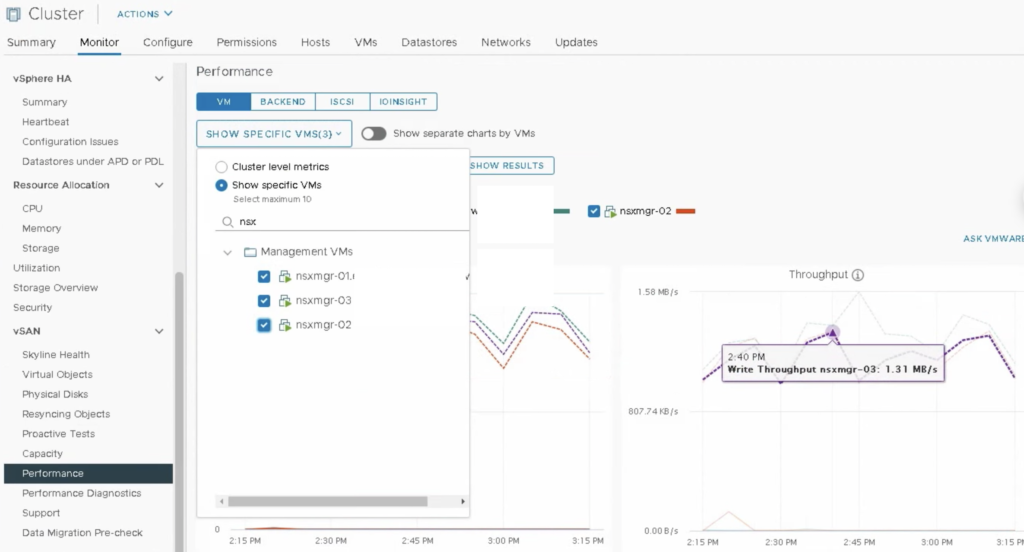
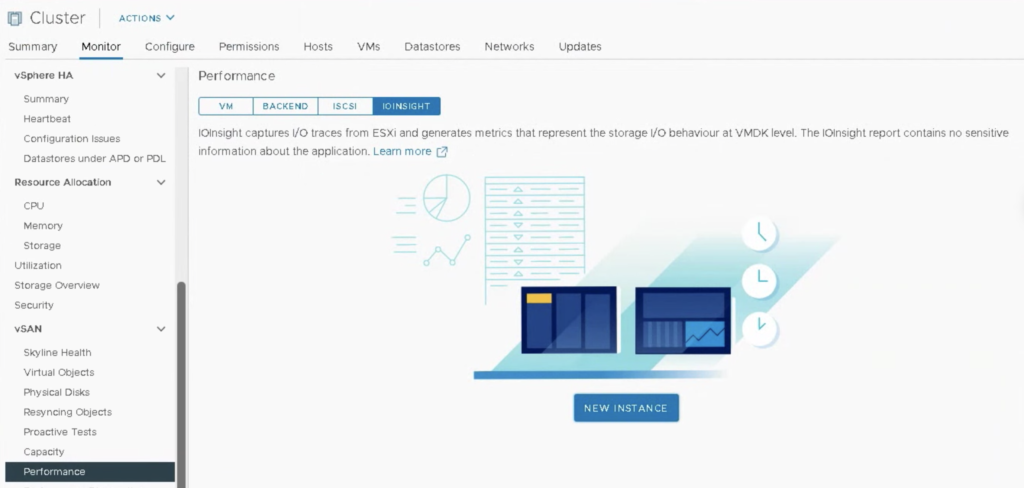
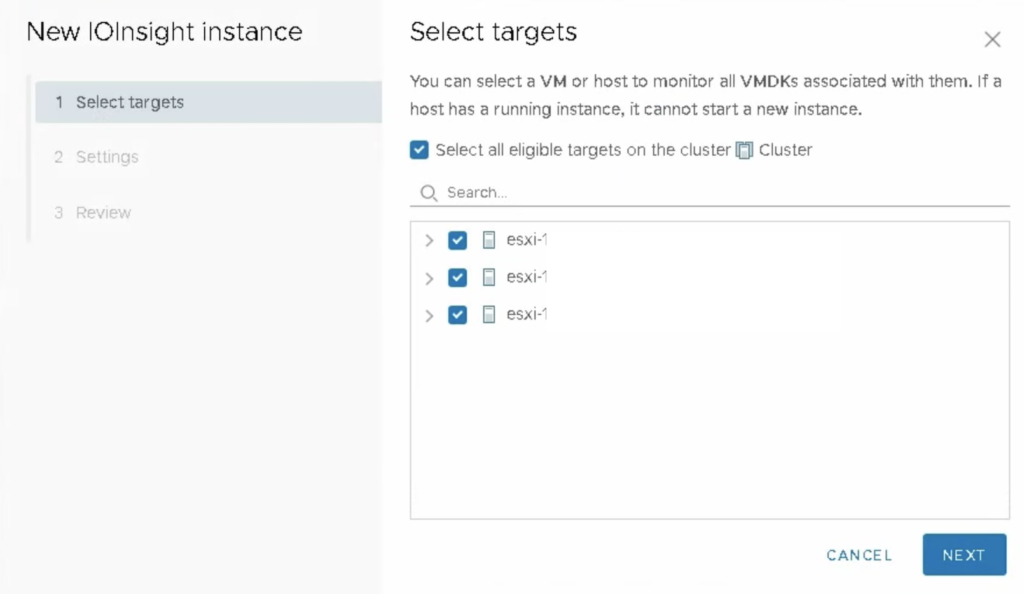
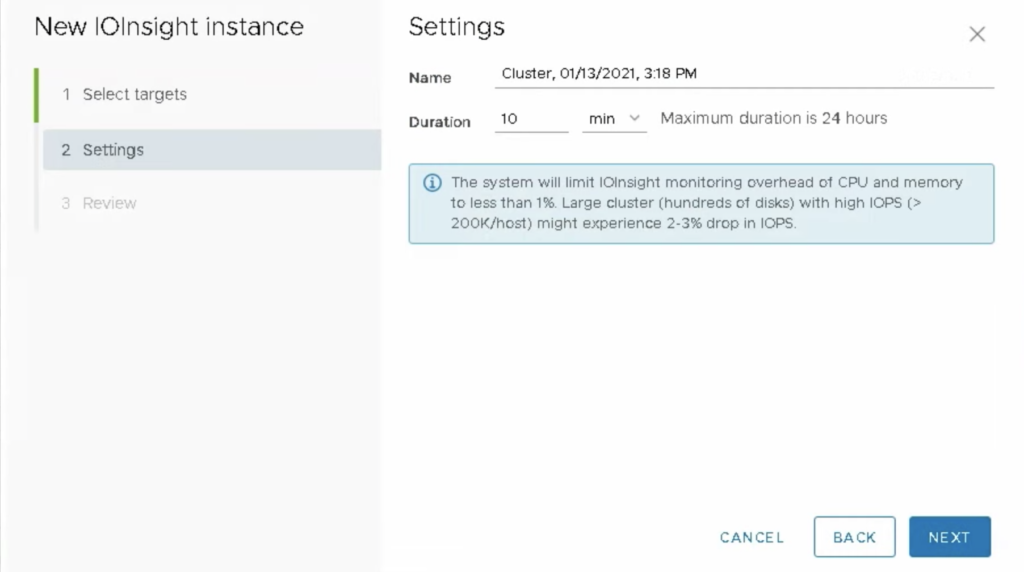
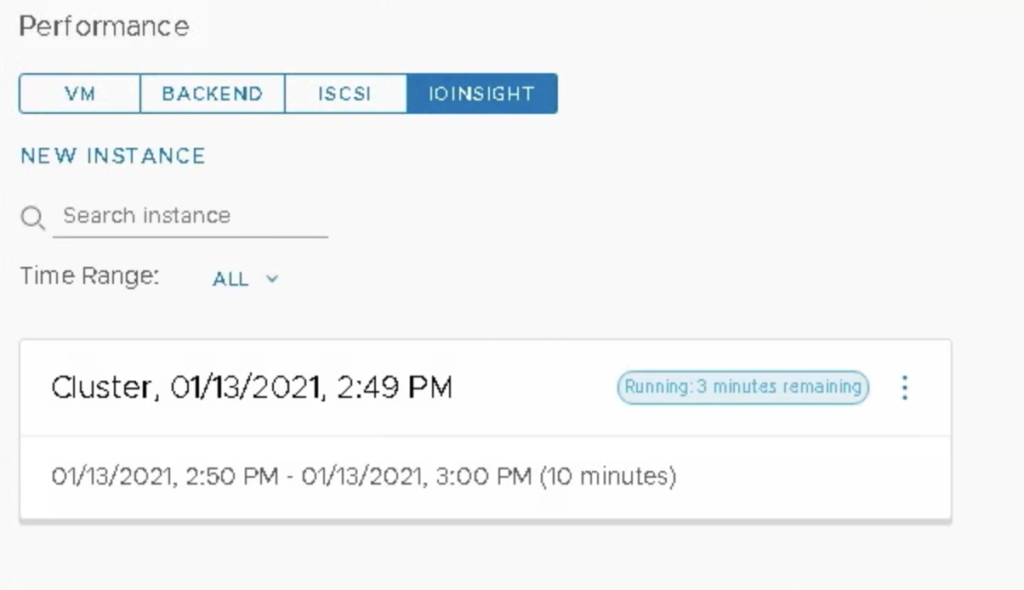
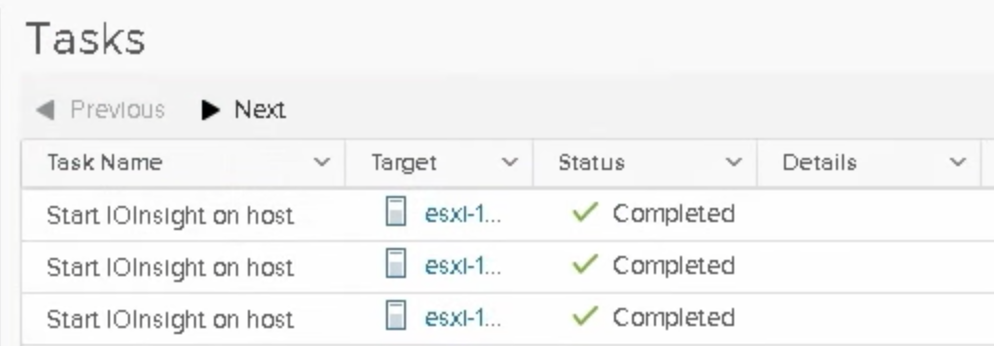
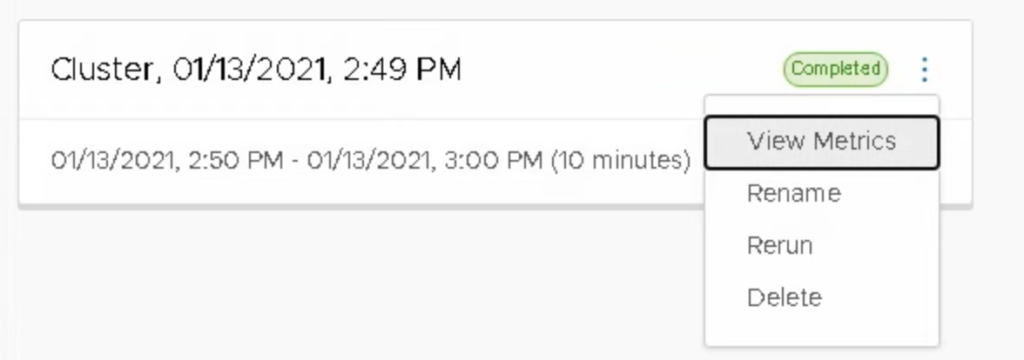
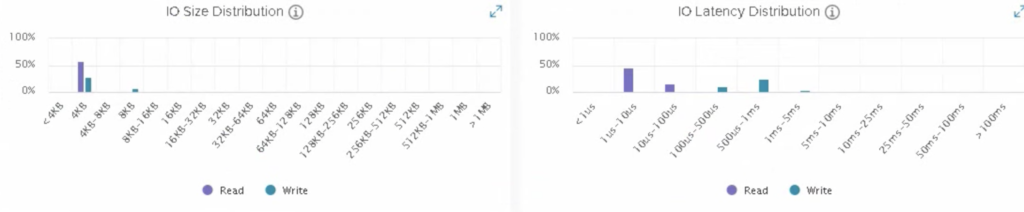
IOINSIGHT
Now the famous VMware fling IOInsight is integrated with vCenter UI performance tab. We can run an instance of it on the selected target hosts and monitor in detail I/O performance of VMs.
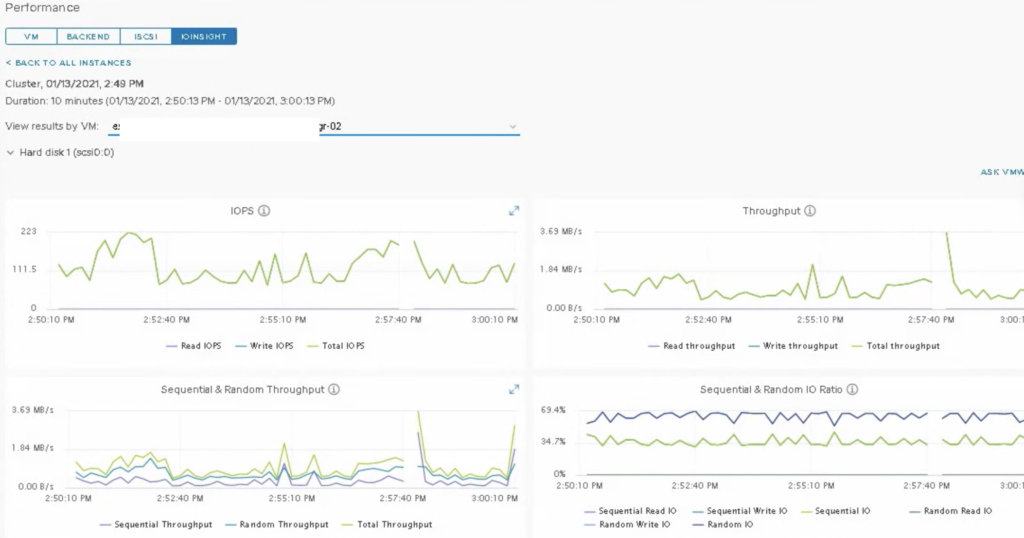
I/O Performance comparison between VMs
We can now pick up to 10 VMs and compare I/O performance between them for more detailed analysis on how does a certain VM behaves in comparison to others on a shared chart or use separated charts.